| 2019 | Since Federal Reserve went operational in 1914, the U.S. dollar has lost 97% of its purchasing power. Since 1910, the U.S. national debt has grown from $2.6 billion to $22 trillion with unfunded liabilities for social security and health care benefits estimated at $240 trillion. |
| 2019-01 | Germany, France, and the UK introduce INSTEX (Instrument in Support of Trade Exchanges). The intent of the special-purpose vehicle is to facilitate transactions between Iran and Europe that bypass the U.S. dollar and SWIFT so as to protect EU banks against legal exposure for breaking sanctions against Iran. Five additional countries (Belgium, Denmark, Finland, the Netherlands, and Sweden) announce on November 29, 2019, that they will join the INSTEX mechanism. |
| 2019-03 | Italy endorses China's Belt and Road Initiative and signs related commercial deals. Italy also borrows money (in yuans) in China's $12 trillion bond market. |
| 2019-05 | The annual Bilderberg Meeting is held in Switzerland. Their number-one topic is "a stable world order." |
| 2019-05-02 | 'Sullivan & Cromwell's Rodge Cohen: The Untold Story of the Fed's $29 Trillion Bailout 2008 Bail Out. Do we want to include it?' |
| 2019-05-05 | The annual Bilderberg Meeting is held in Switzerland. Their number-one topic is a stable world order.” |
| 2019-05-24 | SpaceX launches its first 60 operational Starlink satellites. |
| 2019-06 | Russian economist and Putin adviser Sergey Glazyev states, "The U.S. is the most powerful economy in the world. If we want to avoid dollar hegemony, the first thing we need to do is to avoid using dollars, because the foundation of the U.S. economy is based on the dollar reserves owned by other countries and this has given it the ability and confidence to press other countries to play by its rules. U.S. influence would eventually be weakened if we do so." |
| 2019-06-06 | Xi Jinping and Putin reach currency agreement. The draft decree states, "Settlements and payments for goods, service and direct investments between economic entities of the Russian Federation and the People's Republic of China are made in accordance with the international practice and the legislation of the sides' states with the use of foreign currency, the Russian currency (rubles) and the Chinese currency (yuan)." |
| 2019-06-28 | World Bank Launches First-Ever Pandemic Bonds to Support $500 Million Pandemic Emergency Financing Facility |
| 2019-07 | JPMorgan strategist Craig Cohen writes in note to investors, "We believe the dollar could lose its status as the world's dominant currency (which could see it depreciate over the medium term) due to structural reasons as well as cyclical impediments." |
| 2019-07 | Elon Musk gives presentation about Neuralink brain-machine interfaces, a technology that he views as allowing a "merging with AI." Musk states that he expects to have Neuralink in a human patient by the end of 2020. Harvard professor Charles Lieber, an expert in nanotechnology and "ultraflexible mesh electronics," is one of the top scientists in dialogue with Musk and Neuralink. |
| 2019-07-20 | The G7 finance ministers agree to a Crypto Action Plan. |
| 2019-07-28 | Bohemian Grove meets |
| 2019-08 | President Erdogan says that Turkey's trade with China, Russia, and Ukraine will use national currencies. This statement follows similar agreements reached in 2018 with Iran and Russia to trade in national currencies. In 2018, Erdogan also calls on Turks to convert their dollars and euros into Turkish lira. |
| 2019-08-15 | G7 central bankers meet in Jackson Hole Wyoming to review Going Direct" plan by former central bankers of Switzerland Canada the U.S. and Israel now working at BlackRock an investment manager of $7trillion in stock and bond funds soon retained by the Fed to manage some of its "Going Direct" portfolios. MarkCarney of the Bank of England gives an interview stating that the dollar reserve currency system cannot remain as is.” |
| 2019-09 | French President Macron gives speech to French ambassadors after the French host G7 meeting. Macron declares the failure of the unipolar model due to American failures and mistakes over several administrations and proposes a radical rethinking of strategy going forward to adapt to the emerging multipolar world and the rise of China. |
| 2019-09-17 | U.S. Federal Reserve begins a repo loan bailout program making hundreds of billions of dollars a week in loans by going direct" to the trading houses on Wall Street." |
| 2019-09-19 | U.S. Navy confirms that three F-18 gun camera videos first released by The New York Times and a UFO research organization show "unidentified aerial phenomena" or UAPs - a more formal term for UFOs. The implication is that the U.S. military does not control U.S. air space. |
| 2019-09-19 | The ID2020 Alliance - led by Microsoft, Accenture, IDEO, GAVI, and the Rockefeller Foundation and incorporated into the UN Sustainable Development Goals - hosts its annual summit in New York City. Among other goals, ID2020 aims to offer "a persistent digital identity from birth" using "cutting-edge infant biometric technologies" and microchip implants. |
| 2019-10-05 | Pentagon awards $10 billion JEDI cloud computing contract to Microsoft. |
| 2019-10-07 | The BIS publishes the G7 Working Group on Stablecoins report Investigating the impact of global stablecoins." |
| 2019-10-18 | A rising number of CEO resignations Johns Hopkins Center for Health Security and World Economic Forum hold Event 201 a pandemic tabletop exercise" simulating the outbreak of a novel coronavirus that becomes a pandemic." |
| 2019-10-18 | The Bill & Melinda Gates Foundation, Johns Hopkins Center for Health Security, and World Economic Forum hold Event 201, a "pandemic tabletop exercise" simulating the outbreak of a novel coronavirus that becomes a pandemic. |
| 2019-10-25 | Pentagon awards $10 billion JEDI cloud computing contract to Microsoft. |
| 2019-11 | Vaxxed II: The People's Truth (a sequel to the 2016 documentary Vaxxed) is released, providing overwhelming documentation that vaccines are neither safe nor effective - and are directly connected to an epidemic of autism and chronic disease slowly destroying the American people and their family wealth. |
| 2019-11 | Following BRICS meeting, President Putin says, "The dollar enjoyed great trust around the world but for some reason it is being used as a political weapon, imposing restrictions. Many countries are now turning away from the dollar as a reserve currency. The U.S. dollar will collapse soon." |
| 2019-11-13 | Italy endorses China's Belt and Road Initiative and signs related commercial deals. Italy also borrows money (in yuan) in China’s $12 trillion bond market. Xi Jinping and Putin reach a currency agreement. The draft decree states Settlements and payments for goods service and direct investments between economic entities of the Russian Federation and the People's Republic of China are made in accordance with the international practice and the legislation of the sides'' states with the use of foreign currency the Russian currency [rubles] and the Chinese currency [yuan].” Following the 11th BRICS summit in Brazil on November 13-14 President Putin states "The dollar enjoyed great trust around the world but for some reason it is being used as a political weapon imposing restrictions. Many countries are now turning away from the dollar as a reserve currency. The U.S. dollar will collapse soon.” In mid-November reports emerge from Wuhan that there is a lockdown for a coronavirus. |
| 2019-11-13 | Denmark-based tech company BiChip cancels launch of microchip implant readable from a distance and connected to the Internet in the face of
protests by Christian activists. BiChip has contracts to produce the microchip implants for the Danish governmentand U.S. Navy. A 2018 update to the implants allows wearers to store Ripple cryptocurrencies using Ripple's payment system. |
| 2019-11-14 | Amazon, which manages the CIA and intelligence clouds, notifies U.S. Court of Federal Claims of its intent to protest award of JEDI contract to Microsoft. |
| 2019-12 | U.S. creates the United States Space Force to be the space operations service branch of the United States Armed Forces. |
| 2019-12 | Verizon 5G rollout in several U.S. cities, including Los Angeles, goes into effect. The 5G rollout has begun and accelerates to support the "Going Direct" global reset, marked by competition between the U.S. and China over who controls the telecommunications hardware and AI access to data. |
| 2019-12-2,3 | Video footage from the Global Vaccine Safety Summit - organized by the World Health Organization and held at the WHO's headquarters in Geneva, Switzerland - captures reports of growing global resistance to vaccinations based on the absence of any scientific studies showing that individual or collective vaccinations and vaccination schedules are safe and effective. It appears that the global vaccine push is about to stall for lack of scientific support. |
| 2019-12-09 | U.S. creates the United States Space Force to be the space operations service branch of the United States Armed Forces |
| 2019-12-12 | Basel Committee invites comments on the design of a prudential treatment for crypto-assets by March 13, 2020. |
| 2019-12-15 | Verizon 5G rollout in several U.S. cities including Los Angeles goes into effect. The 5G rollout has begun and accelerates to support the Going Direct” global reset marked by competition between the U.S. and China over who controls the telecommunications hardware and AI access to data." |
| 2019-12-18 | MIT researchers publish study—funded by the Gates Foundation and directly requested by Bill Gates—that establishes a proof of concept for intradermal on-person vaccination record keeping." The study uses dissolvable microneedles to codeliver vaccines and "near-infrared quantum dots" into the skin that encode information about vaccination status readable by modified smartphones. The senior author says the invisible "tattoos" could create "new possibilities for data storage bio-sensing and vaccine applications.” |
| 2019-12-31 | China's WHO office is informed of "unknown pneumonia" cases in Wuhan. |
| 2020-01,02 | A rising number of CEO resignations permits corporate leaders to sell their stocks at or near the market high. Reports of selling by members of Congress who receive early briefings on Covid-19 circulate. Jeff Bezos of Amazon is reported to sell $4 billion of Amazon stock. |
| 2020-01-09 | WHO announces "coronavirus-related" pneumonia in China. |
| 2020-01-13 | What to expect from G10 central banks in 2020 2020 Expectation |
| 2020-01-19 | FASAB Statement 56: Understanding New Government Financial Accounting Loopholes Financial accountability for the government is a cornerstone of a functioning representative democracy. The ability for the people to know where taxpayer money goes to is crucial to having an informed opinion regarding the actions of your representatives and to react accordingly. |
| 2020-01-24 | The World Economic Forum meets in Davos and launches its Global Reset website to market the Going Direct plan to young people and non-financial sectors. |
| 2020-01-28 | U.S. attorney for Massachusetts indicts Harvard chemistry professor Charles Lieber for allegedly lying about foreign financial conflicts of interest with Chinese universities. Lieber's research spans the areas of nanomaterials, nano-bioelectronics, and brain science. The brain science program focuses on "a conceptually novel approach for integrating electronics within the brain and other areas of the nervous system, which involves the development of neural network-like mesh electronics and a noninvasive delivery method into targeted distinct brain regions via syringe-injection." The brain science work also seeks to "enhance human performance via brain-machine interface." |
| 2020-01-29 | Federal Reserve Holds Benchmark Rate Steady |
| 2020-01-31 | United Kingdom withdraws from the European Union (thus protecting its global offshore haven system from EU regulators and disclosure requirements) |
| 2020-01-31 | WHO declares a Global Health Emergency. The UK reports its first coronavirus case. The U.S. restricts entry of passengers from China. |
| 2020-02 | The U.S. Navy awards a $7 billion cloud contract to Leidos. Lockheed Martin spun out its government IT division to Leidos after the 2015 fiscal year in which the Army reported $6.5 trillion in undocumentable adjustments. Leidos has large contracts in Antarctica. |
| 2020-02-02 | A rising number of CEO resignations Johns Hopkins Center for Health Security and World Economic Forum hold Event 201 a pandemic tabletop exercise" simulating the outbreak of a novel coronavirus that becomes a pandemic. |
| 2020-02-02 | Global air travel is restricted. There are 20,000 confirmed coronavirus cases in 24 countries and over 300 deaths, mostly in China. |
| 2020-02-07 | The CIA begins multibillion-dollar procurement process to update its cloud technology as part of the Commercial Cloud Enterprise (C2E) process. |
| 2020-02-16 | UPDATE 1-Foreigners sold U.S. Treasuries for 4th straight month in November -data International Sales of UST. |
| 2020-02-19 | Facebook Twitter LinkedIn Email Print Extraordinary times require extraordinary action, says ECB President Christine Lagarde | Thomas Lohnes/Getty Images European Central Bank announces 750B coronavirus stimulus The European Central Bank (ECB) announced an economic stimulus program worth 750 billion Wednesday night. |
| 2020-02-25 | The CDC says Covid-19 is heading toward pandemic status. Italy, Iran, and Brazil report major outbreaks. |
| 2020-02-28 | Fed Pulling Back from Repos at The Wrong Time $150B |
| 2020-03 | Oil prices crash more than 20%, dramatically cutting revenues to Russia, Brazil, and other countries in the "de-dollarization" group. Major meltdown in $20 trillion US Treasury market begins. |
| 2020-03-01 | US Banks propose a cut of bank reserve requirements from 10% to 0% 10% - 0% Reserve Requirement |
| 2020-03-03 | Mnuchin Ready to Work With Congress on Emergency Funding Package Unspecified |
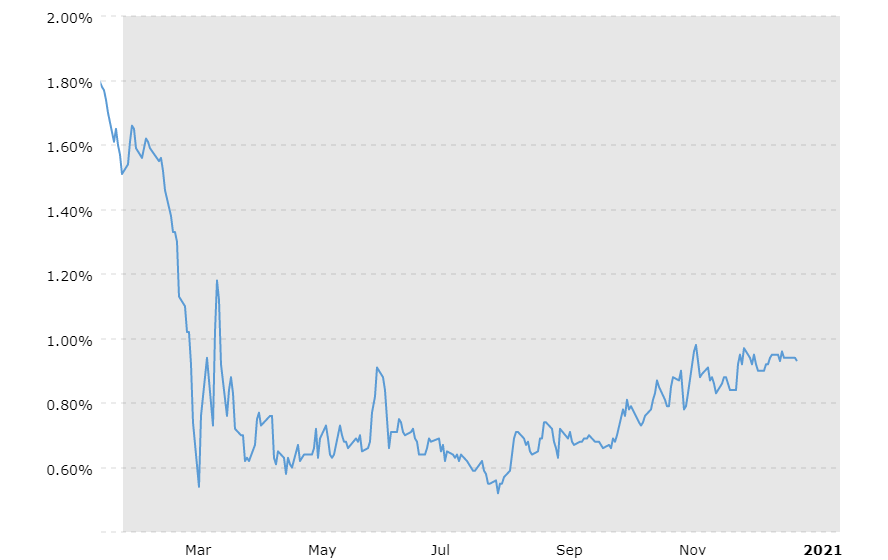
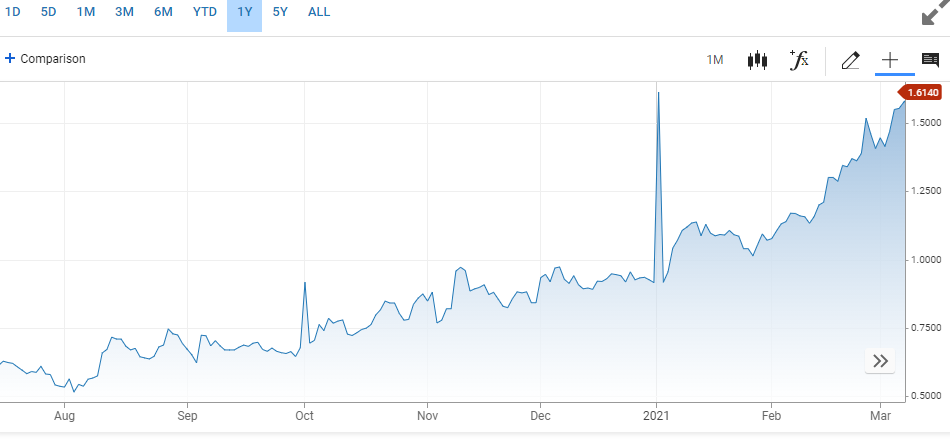
| 2020-03-03 | Yield on 10-Year Treasury Dips Below 1% for First Time in Sign of Anxiety UST drops below 1% |
| 2020-03-03 | The FCC authorizes SpaceX to begin rolling out up to one million ground antennas to connect Starlink satellites to end users. |
| 2020-03-04 | Congress Reaches $8 Billion Deal to Combat Coronavirus $8.3B |
| 2020-03-06 | EU pledges 25 billion to weather coronavirus impact e250B.. |
| 2020-03-06 | SpaceX expresses intent to compete for $16 billion in government subsidies for satellite Internet in rural areas. |
| 2020-03-09 | No, cash does NOT carry coronavirus, says WHO The rapid spread of COVID-19, followed by the even faster spread of mass panic and signs of recession calls for much-needed clarity regarding cash and coronavirus.” |
| 2020-03-09 | Fed Turns to Crisis-Era Playbook to Combat Market Disruptions $150B Overnight Repo Lending |
| 2020-03-09 | Arthur Firstenberg republishes The Invisible Rainbow: A History of Electricity and Life (originally published in 2017) documenting the significant increases in disease and death resulting from the progressive adoption of electricity and increases in EMF radiation. The book raises profound questions regarding the potential impact of 5G technology on the human race. |
| 2020-03-10 | Democrats urge Trump to declare national emergency for coronavirus, a move that would release $40 billion in funds Senate Democrats plan to urge President Donald Trump to declare a national emergency in response to the coronavirus outbreak, which has sickened more than 1,000 in the US. |
| 2020-03-10 | Germany Mulls Bank Capital Relief to Counter Coronavirus Hit C-19 |
| 2020-03-10 | Mortgage payments suspended across Italy amid coronavirus outbreak Mortgage payments suspended across Italy amid coronavirus outbreak By Caitlin O''Kane March 10, 2020 / 4:06 PM / CBS News Homeowners across Italy will get a grace period on their mortgage payments as the country is on lockdown due to the spread of coronavirus. The country expanded its quarantine to include the entire nation of 60 million people until next month, the prime minister announced Monday. |
| 2020-03-10 | Fed jumps back into the Repo Market - Treasury shoveling out $8 billion Fed jumps back into the Repo Market - Treasury shoveling out $8 billion |
| 2020-03-11 | House Passes War Powers Resolution Limiting President's Ability to Strike Iran The measure passed 227-186, sending the bill to the president's desk. Six Republicans voted with Democrats in favor. While it directs President Trump to end the use of military force against Iran unless authorized by Congress, it doesn't prevent the U.S. from defending itself agains imminent attack. |
| 2020-03-11 | Treasuries Liquidity Drying Up Puts $50 Trillion in Question Fed jumps back into the Repo Market - Treasury shoveling out $8 billion |
| 2020-03-11 | Trump Administration to Delay April 15 Tax Deadline for Most Individuals Tax Filing Delay |
| 2020-03-11 | U.K. Sends a Jolt of Economic Stimulus to Cushion Against the Coronavirus ($387 billion) in new loans to companies |
| 2020-03-11 | Oil prices crash more than 20% dramatically cutting revenues to Russia Brazil and other countries in the de-dollarization" group. Major meltdown in the $20trillion U.S. Treasury market begins." |
| 2020-03-11 | The WHO declares Covid-19 a pandemic. This means that the waiver of liability under the U.S. PREP Act of 2005 applies. |
| 2020-03-12 | Economic Response to the Coronavirus The Government is acting decisively in the national interest to support households and businesses and address the significant economic consequences of the Coronavirus. |
| 2020-03-12 | Statement Regarding Treasury Reserve Management Purchases and Repurchase Operations Treasury Reserve Management |
| 2020-03-12 | T-Bills Are Scarce and the Shortage Is About to Get Even Worse |
| 2020-03-12 | Pentagon seeks court permission to "reconsider certain aspects" of the decision to award the JEDI cloud computing contract to Microsoft. |
| 2020-03-13 | 'Germany lines up $600 billion virus aid as EU backs stimulus Germany pledged to spend whatever necessary to protect its economy and the European Commission said it's ready to green-light widespread fiscal stimulus for euro nations as policy makers aimed to calm the markets with a decisive response to the coronavirus.' |
| 2020-03-13 | The U.S. issues a travel ban on passengers from 26 European countries, excluding the UK and Ireland. Four days later, the European Union restricts travelers from outside the Union. |
| 2020-03-14 | Fed May Target Commercial Paper Purchases, BofA Says Commercial Paper Purchases |
| 2020-03-15 | Federal Reserve slashes interest rates to zero as part of wide-ranging emergency intervention The Federal Reserve announced on Sunday it would drop interest rates to zero and buy at least $700 billion in government and mortgage-related bonds as part of a wide-ranging emergency action to protect the economy from the impact of the coronavirus outbreak. |
| 2020-03-15 | Federal Reserve cuts reserve requirement for U.S. banks to 0%. |
| 2020-03-16 | Bank of Japan Rolls Out Measures to Blunt Coronavirus Impact TOKYO The Bank of Japan said it would double stock purchases and help companies get loans in response to the coronavirus pandemic, but the move failed to impress investors, who drove stocks down 2.5%. |
| 2020-03-16 | BOJ expands monetary stimulus to defend economy from coronavirus TOKYO -- The Bank of Japan expanded its monetary stimulus at a hastily called one-day policy meeting on Monday joining other central banks rushing to support a global economy hit by the spreading coronavirus. ($112.46 billion) and of real-estate investment trusts to 180 billion yen per year.” |
| 2020-03-16 | Fed says it will offer an additional $500 billion in overnight repo funding markets A day after a dramatic move in interest rates, the Federal Reserve on Monday increased the amount of liquidity it's offering in short-term lending to the financial industry. |
| 2020-03-17 | Trump Administration Seeks to Send Checks to Americans as Part of Stimulus Package $1T Stimulus Package |
| 2020-03-17 | Fed Launches Primary Dealer Credit Facility Which Will Accept Stocks As Collateral Stocks as Collateral |
| 2020-03-17 | Fed to Relaunch Primary Dealer Credit Facility The Federal Reserve said Tuesday it would relaunch a crisis-era facility that allows large financial institutions access to short-term loans. |
| 2020-03-18 | ECB to Buy Bonds to Combat Economic Slowdown From Coronavirus $818.7 billion |
| 2020-03-18 | Warp Speed Stimulus Finally Passes Senate Industry Bail Outs |
| 2020-03-18 | FISA Update The need to gear up Washington's response to the coronavirus pandemic is obviously, and appropriately, squeezing out the time available to deal with other issues. So it is with FISA (the Foreign Intelligence Surveillance Act), specifically with the three PATRIOT Act provisions that were the subject of my column this past weekend â roving wiretaps, lone-wolf surveillance, and business records production. |
| 2020-03-18 | Shanghai Cooperation Organisation To Introduce Mutual Settlement In National Currencies '' And Ditch US Dollar The eight-member countries of the Shanghai Cooperation Organization (SCO), including China, Russia, and India, have made the decision to conduct bilateral trade and investment and issue bonds in local and national currencies instead of US dollars. |
| 2020-03-18 | 'Senate Passes Paid-Leave Bill to Combat Pandemic, Turns to Administration's Stimulus Plan Treasury Stimulus' |
| 2020-03-18 | SpaceX launches 60 more Starlink satellites, bringing its total to over 350 since the company began sending up batches of 60 in 2019. The FCC has approved close to 12,000 SpaceX satellites, and SpaceX has filed applications for another 30,000. |
| 2020-03-18 | Bill Gates holds an "Ask Me Anything" Q&A on Reddit, one week after stepping down from the boards of Microsoft and Berkshire Hathaway. Gates calls for a national coronavirus tracking system, including "digital certificates" that show who has (and has not) been vaccinated. |
| 2020-03-18 | Denmark passes emergency law allowing forced coronavirus vaccination. Copenhagen University law professor Jens Elo Rytter describes the law as "certainly the most extreme since the Second World War. Legislation coincides with Denmark central bank receiving a swap line from the Federal Reserve." |
| 2020-03-19 | Bank of England Cuts Rates Further, Restarts Bond Purchases LONDON The Bank of England cut its benchmark interest rate to a record low and said it would buy £200 billion ($232 billion) of U.K. government bonds, the latest in a flurry of central-bank action to combat the economic damage form the coronavirus. |
| 2020-03-19 | Federal Reserve announces the establishment of temporary U.S. dollar liquidity arrangements with other central banks The Federal Reserve on Thursday announced the establishment of temporary U.S. dollar liquidity arrangements (swap lines) with the Reserve Bank of Australia, the Banco Central do Brasil, the Danmarks Nationalbank (Denmark), the Bank of Korea, the Banco de Mexico, the Norges Bank (Norway), the Reserve Bank of New Zealand, the Monetary Authority of Singapore, and the Sveriges Riksbank (Sweden)." |
| 2020-03-19 | Federal Reserve to Backstop Money-Market Mutual Funds Amid Coronavirus $700 billion in Treasury securities and mortgage bonds. |
| 2020-03-19 | House Democrats eyeing much broader Phase 3 stimulus US bailout legislation |
| 2020-03-19 | 'Italian PM says EU must use 500 billion euro rescue fund during virus outbreak Italian Prime Minister Giuseppe Conte said in an interview that the European Union must use the full firepower of its 500 billion euro ($534.10 billion) rescue fund to confront Europe's economic crisis during the coronavirus outbreak.' |
| 2020-03-19 | Reserve Bank Purchases of Government Securities The Bank will undertake multi-price auctions for government securities. The size and composition of purchases will be determined subject to market conditions and will vary across auctions. |
| 2020-03-19 | Statement by Philip Lowe, Governor: Monetary Policy Decision he coronavirus is first and foremost a public health issue, but it is also having a very major impact on the economy and the financial system. |
| 2020-03-19 | Term Funding Facility to Support Lending to Australian Businesses The Reserve Bank is establishing a facility to offer three-year funding to authorised deposit-taking institutions (ADIs). |
| 2020-03-19 | California becomes the first U.S. state to issue a stay-at-home order. China reports zero local infections. |
| 2020-03-20 | Fed could buy $4.5 trillion of debt if it starts snapping up corporate bonds, says Bank of America As the Fed launches one lending program after another investors are now calling for the Federal Reserve to aim its sights on the more than $9 trillion U.S. corporate bond market.” |
| 2020-03-20 | Reserve Bank of Australia and US Federal Reserve Announce Swap Arrangement The Reserve Bank of Australia and the Federal Reserve will establish a temporary reciprocal currency arrangement (swap line) for the provision of US dollar liquidity. |
| 2020-03-20 | The Federal Reserve is expanding its asset purchases to include municipal bonds The Federal Reserve said Friday it would extend its asset purchase program into short-term municipal bonds. |
| 2020-03-21 | Fed between $1.3 trillion and $1.4 trillion. Treasury $60B to Airlines.” |
| 2020-03-21 | Coronavirus Rescue Bill Moving Toward a Final Senate Vote Monday Fed between $1.3 trillion and $1.4 trillion. Treasury $60B to Airlines." |
| 2020-03-21 | 'Socialism at Its Finest after Fed's Bazooka Fails Failure of Monetary System..' |
| 2020-03-23 | Supporting the Flow of Credit Under the Coronavirus SME Guarantee Scheme, the Government will provide a guarantee of 50 per cent to SME lenders to support new short-term unsecured loans to SMEs.” |
| 2020-03-23 | Federal Government coronavirus economic stimulus stage 2 The Federal Government has announced stage 2 of its economic plan to cushion the economic impact of the coronavirus (COVID-19) and help build a bridge to recovery. |
| 2020-03-23 | 'New Coronavirus Stimulus Bill In Congress Creates U.S. Digital Dollar Digi Dollar rears it's ugly head..' |
| 2020-03-23 | This Is a Trap: Progressives Sound Alarm as GOP Attempts Sneak Attack on Social Security in Coronavirus Stimulus Plan Entitlement Snatch |
| 2020-03-23 | The UK goes on lockdown. |
| 2020-03-24 | Federal Government coronavirus economic stimulus stage 1 $17.6 Billion |
| 2020-03-24 | Federal Government coronavirus economic stimulus stage 1 Slew of measures announced by the Federal Government as an initial response to the challenges posed to the economy by the spread of |
| 2020-03-25 | 'GOP Senators Warn They Will Oppose CCP Virus Bill Unless Massive '' Error Is Fixed NA' |
| 2020-03-25 | Negative rates come to the US: 1-month and 3-month Treasury bill yields are now below zero Zero Interest Rates have appeared. C-19 Strikes again |
| 2020-03-25 | 'US Senate's Final Stimulus Bill '' Why It Won't be Enough $6.2 Trillion' |
| 2020-03-26 | The U.S. Senate passes the CARES Act. |
| 2020-03-27 | A Visualization of the CARES Act $2.3 Trillion stimulus broken down |
| 2020-03-27 | Bizarre Rise In Libor Prompts Questions About One Or More Banks In Trouble LIBOR prestidigitation |
| 2020-03-27 | Bonanza for Rich Real Estate Investors, Tucked Into Stimulus Package Large Real Estate developer subsidies..(pork) |
| 2020-03-27 | Dow Rallies 6.4% After Stimulus Vote Markets react to QE III. |
| 2020-03-27 | EPA suspends enforcement of environmental laws amid coronavirus The Environmental Protection Agency (EPA) issued a sweeping suspension of its enforcement of environmental laws |
| 2020-03-27 | Here Is A Breakdown Of The $12 Trillion In Global Stimulus Passed This Month Breakdown of global stimulus plans. |
| 2020-03-27 | 'Market Talk '' March 27, 2020 he Reserve Bank of India's Monetary Policy Committee met today and announced a series of measures to counter the economic slowdown caused by the novel coronavirus pandemic. The repo rate and reverse repo rate have been cut by 74 bps and 90 bps respectively.' |
| 2020-03-27 | U.S. to Take Stakes in Airlines in Exchange for Grants, Mnuchin Says #2T Rescue Package USG will acquire share of airline/s. |
| 2020-03-30 | The Flood Begins: Treasury To Sell Over A Quarter Trillion Bills In 48 Hours $250B in 48 hours. |
| 2020-03-30 | YET ANOTHER COINCIDENTAL DEATH OF A FINANCIER IN GERMANY Now according to these two articles, Herr Schaffer, finance minister for the German state of Hesse, is presumed dead of suicide-by-train-collision. |
| 2020-04 | Operation Warp Speed is announced as a U.S. public-private effort to accelerate the funding and launch of Covid-19 injections under U.S. military leadership and operations. |
| 2020-04-01 | Congressman called ''Most Hated Man in Washington '' Stands Alone Against Bailout Thomas Massie explains that the Coronavirus stimulus bill is the largest wealth transfer in human history and would make Roman emperors blush. $6-trillion divided by US population means each family will pay $60000. $1200 given back to taxpayers is cheese in the trap |
| 2020-04-01 | Supporting Individuals and Households This assistance includes income support payments, payments to support households and temporary early releases of superannuation.” |
| 2020-04-01 | Economic Response to the Coronavirus Australian economic response to Coronavirus |
| 2020-04-01 | Support for Businesses Assistance includes cash flow support to businesses and temporary measures to provide relief for financially distressed businesses. |
| 2020-04-01 | Supporting the Flow of Credit Timely access to credit is vital for businesses to manage the impacts of the Coronavirus. |
| 2020-04-02 | Exclusive: G7 to make no direct calls for fiscal monetary support in coronavirus statement: sources "Group of Seven nations will voice their determination to fight the economic hit of the coronavirus but stop short of directly calling for new government spending or coordinated central bank interest rate cuts two G7 officials said on Tuesday.” |
| 2020-04-03 | 'State and Territory governments '' COVID-19 economic stimulus response Here is what the individual Australian states and territory governments are doing to help the economy and its people stay afloat through this unprecedented time.' |
| 2020-04-04 | Catherine Austin Fitts - We are Dealing with a Spiritual War Why the sudden record gun buying in America? Investment advisor and former Assistant Secretary of Housing Catherine Austin Fitts says “They understand that the rule of law is steadily being diminished." |
| 2020-04-04 | Speaker Pelosi Aims to Bring Up Next Virus Stimulus This Month Communities in the U.S. cannot afford to wait for the next coronavirus stimulus, Speaker Nancy Pelosi said in a letter to House lawmakers, adding it is my hope that we will craft this legislation and bring it to the floor later this month.” |
| 2020-04-05 | Fed Official Says Central Bankers Are Aligned in Coronavirus Response The move came shortly after a call between finance ministers and central bankers from the Group of 7 which also includes Britain, Canada, France, Germany, Italy and Japan.” |
| 2020-04-05 | Goldman Warns Of A "Significant " Adverse Impact On Stocks As 2020 Buybacks Are Cut In Half One week later, with the market below last Friday's lows, it appears that nobody knows what the correct answer is. So, to narrow down the confusion, Goldman's clients have shifted their attention to a just a more easily answerable question: will the buybacks that helped push the market to all time highs on increasingly less volume, still be there in the coming months? |
| 2020-04-05 | Spanish Government Aims to Roll Out Basic Income âSoon '' The Spanish government is working to roll out a universal basic income as soon as possible, as part of a battery of actions aimed at countering the impact of the coronavirus pandemic, according to Economy Minister Nadia Calvino. |
| 2020-04-05 | Supporting Individuals and Households The Australian Government is providing financial assistance to Australians to support them through the Coronavirus. This assistance includes income support payments, payments to support households and temporary early releases of superannuation.” |
| 2020-04-05 | 'These Are the Options for Europe's Giant Virus Rescue Package The bloc's leaders have asked them to come up with a set of proposals to help mitigate the economic impact of the coronavirus by the end of this week and the ministers are aiming to reach a consensus during a video conference Tuesday.' |
| 2020-04-06 | John Titus Video Interview Corbett Report Video Interview John Titus |
| 2020-04-07 | Trump Removes Watchdog Who Heads Panel Overseeing Pandemic Stimulus Spending President Trump replaced the Pentagon's acting inspector general, who had been charged with monitoring the roughly $2 trillion pandemic stimulus law, administration officials said, the latest shake-up in a bid by Mr. Trump to exert increased control over personnel across the government. |
| 2020-04-07 | U.S. small businesses drown in red tape awaiting lifeline. As U.S. small businesses crumble, their employees overload unemployment websites, and the software used to hand out loans crashes, it's important to know there are alternatives. Like this one, from Switzerland: |
| 2020-04-07 | 'Interview 1533 '' John Titus Exposes the Fed's Coronavirus Lies Best Evidence Founder John Titus' |
| 2020-04-09 | Fed Expands Corporate-Debt Backstops Unveils New Programs to Aid States Cities and Small Businesses The Federal Reserve unveiled an array of programs Thursday that it said would provide $2.3 trillion in loans expanding the Fed's operations to reach small and midsize businesses and U.S. cities and states. |
| 2020-04-09 | Report on the comprehensive economic policy response to the COVID-19 pandemic Coordinated actions taken so far at the level of the Member States the EU and the euro area" |
| 2020-04-10 | New Law Helps You Delay Mortgage Payments and Prevent Foreclosure If you''ve been financially affected by the novel coronavirus (COVID-19) pandemic you may be wondering how you are going to make upcoming mortgage payments. |
| 2020-04-10 | The Fed's Balance Sheet: The Other Exponential Curve As the threat of COVID-19 keeps millions of Americans locked down at home, businesses and financial markets are suffering. |
| 2020-04-12 | My conversation with State Senator and doctor who exposes Medicare payouts for COVID-19 patients. As you'll see by end of this article the specific decisions about money mentioned here affect life and death outcomes for patients.” |
| 2020-04-13 | IMF Executive Board Approves Immediate Debt Relief for 25 Countries This provides grants to our poorest and most vulnerable members to cover their IMF debt obligations for an initial phase over the next six months and will help them channel more of their scarce financial resources towards vital emergency medical and other relief efforts. |
| 2020-04-15 | World Bank Group President David Malpass: Remarks to G20 Finance Ministers The World Bank Group has been focused on taking fast, broad-based action, especially for the poorest countries.” |
| 2020-04-15 | RPT-U.S. opposition seen stalling major IMF liquidity boost U.S. opposition is expected to prevent the International Monetary Fund this week from deploying one of its most powerful tools to help countries fight the coronavirus: creating a new allocation of Special Drawing Rights. |
| 2020-04-15 | As the U.S. economy shuts down for coronavirus restrictions the March U.S.-China trade deficit is less than half of that of the prior year" |
| 2020-04-15 | The IMF warns against "contraction of the global economy." |
| 2020-04-16 | IMF Executive Board approves immediate debt service relief for 25 eligible low-income countries According to IMF's press statement received here Thursday, a further four countries were expected to request such relief in the coming weeks. |
| 2020-04-16 | Over 43000 US millionaires will get âstimulus '' averaging $1.6 million each At least 43000 American millionaires who are too rich to get coronavirus stimulus checks are getting a far bigger boost â averaging $1.6 million each according to a congressional committee. |
| 2020-04-16 | U.S. Opposes Massive Liquidity IMF Boost: Mnuchin The United States opposes creation of liquidity through issuance of the International Monetary Fund's Special Drawing Rights (SDRs) as part of the response to the coronavirus pandemic, U.S. Treasury Secretary Steven Mnuchin said on Thursday. |
| 2020-04-16 | Funding Exhausted for $350 Billion Small-Business Paycheck Protection Program Lawmakers again fell short of an agreement on the next round of coronavirus emergency aid Thursday |
| 2020-04-17 | Companies That Are Absolutely Not Small Businesses Are Getting Million A federal crisis fund of $350 billion established to keep small businesses afloat during the coronavirus pandemic ran out this week leaving thousands of companies waiting desperately for help.” |
| 2020-04-17 | The Trickle-Up Bailout As we head into the second month of pandemic lockdown, two parallel narratives are developing about the financial rescue.” |
| 2020-04-18 | A Bailout For US Farmers? Federal Government To Give $19 Billion Payments Amid Coronavirus, Trade War Fallout American agriculture has been hard-hit like most of America with the coronavirus and President Trump is standing with our farmers and all Americans to make sure that we all get through this national emergency.” |
| 2020-04-18 | Proposed: $2000 Monthly Stimulus Checks And Canceled Rent And Mortgage Payments For 1 Year The CARES Act provided a lifeline for taxpayers and small businesses. But as a one-time cash payment many fear that it didn't do enough to support taxpayers in one of our country's greatest times of need. |
| 2020-04-19 | Gundlach: Fed COVID Response Is Broken Bond heavyweight Jeff Gundlach has blasted the Federal Reserve as a âfailed '' and âbroken '' institution, claiming the central bank is now acting in contravention of its own charter. |
| 2020-04-19 | Japan to Boost Stimulus to $1.1 Trillion as Virus Threatens Deeper Recession Japan boosted its new economic stimulus package on Monday to a record $1.1 trillion to expand cash payouts to its citizens |
| 2020-04-20 | Something Impossible Just Happened: A CLO Failed Its AAA Overcollateralization Test Over the weekend, we reported that in its quest to bailout the richest Americans and the country's financial system, the Fed unleashed an unprecedented array of actions meant to backstop capital markets, going so far as buying investment grade, high yield bonds and even AAA-rated CLO bonds |
| 2020-04-21 | Senate Passes Bill for More Small-Business Stimulus Congressional leaders struck a deal with the White House Tuesday to send hundreds of billion of dollars in fresh aid to small businesses and hospitals, the federal government's latest effort to keep pace with the twin economic and public health crises created by the coronavirus pandemic. |
| 2020-04-21 | The executive director of the UN World Food Programme (WFP) says the world is facing multiple famines of "biblical proportions" as a result of the coronavirus pandemic. There are already one million people on the verge of starvation, and the pandemic could push an additional 130 million people to the brink of starvation. |
| 2020-04-22 | 'ECB loosens collateral rules to accept âfallen angel '' bonds The European Central Bank has changed its rules to accept fallen angel bonds that lose their investment grade credit rating to maintain banks' |
| 2020-04-22 | EU Eyes $2.2 Trillion Plan as ECB Accepts Some Junk-Rated Bonds ECB accepts Junk Bonds |
| 2020-04-23 | House Approves $484 Billion Bill to Aid Small Businesses, Hospitals House lawmakers, returning to the Capitol in the midst of the coronavirus pandemic, donned masks and kept their distance from colleagues Thursday as they voted to approve the next infusion of aid for small businesses and hospitals grappling with the outbreak's toll. |
| 2020-04-24 | The Congressional Budget Office revises its earlier January estimate of a $1 trillion federal deficit in fiscal 2020 to $3.7 trillion. A later report by Kiplinger states that U.S. state government deficits will reach $500 billion by the end of fiscal 2021. McKinsey Global Institute predicts that global government deficits could be a worldwide $10 trillion deficit in 2020 and a cumulative shortfall of up to $30 trillion by 2023. |
| 2020-04-28 | 'Fed's Power to Buoy Corporate Debt Market Curbed by Bailout Law NA' |
| 2020-04-29 | 'Fed's Powell Says More Spending Will Be Needed From Congress Federal Reserve Chairman Jerome Powell delivered an uncharacteristically blunt call on Wednesday for Congress and the White House to spend more money to prevent deeper economic damage from the coronavirus pandemic.' |
| 2020-04-30 | Tribes Were Supposed To Get $8 Billion In COVID-19 Aid. They've Gotten $0. Tribal governments were supposed to get $8 billion in direct emergency relief from the CARES Act the $2 trillion COVID-19 stimulus bill that became law on March 27 |
| 2020-04-30 | Europe's employment aid keeps jobs from vanishing -- for now Some 11.3 million workers in France are getting up to 84% of net salary. The government estimates the cost at 24 billion euros ($26 billion) with half of all private sector employees expected to take part. |
| 2020-05 | During May 2020, year-over-year growth in the dollar money supply is at 29.8%, up from April's rate of 21.3%, and up from May 2019's rate of 2.15%. |
| 2020-05 | Moncef Slaoui is named Operation Warp Speed chief adviser. Slaoui - a vaccine researcher and, formerly, Chairman of Global Research and Development and Chairman of Global Vaccines at GlaxoSmithKline - is described by the Financial Times in 2012 as an expert on brain-machine interface and bioelectronics. General Gustave F. Perna - Commanding General, Army Materiel Command - is named Operation Warp Speed chief operating officer. The project has a budget of $10 billion, with additional funds allocated through the Biomedical Advanced Research and Development Authority (BARDA) at the U.S. Department of Health and Human Services (HHS). |
| 2020-05-02 | Stimulus Checks Sent to Deceased People NA |
| 2020-05-03 | 'Crushing the States, Saving the Banks: The Fed's Generous New Rules Congress seems to be at war with the states. Only $150 billion of its nearly $3 trillion coronavirus relief package '' a mere 5% '' has been allocated to the 50 states' |
| 2020-05-04 | California First To Be Approved For Up To $10 Billion Bailout From Feds To Pay Unemployment Benefits California has stepped up to the plate with what appears to be a direct request for a bailout to fund the benefits for millions of newly-unemployed residents (and illegal immigrants). |
| 2020-05-05 | UPDATE 2-German court's ECB bond buy ruling hits euro, bonds, stocks The euro southern government bonds and European stocks lost ground on Tuesday after Germany's top court ruled that the Bundesbank must stop buying bonds under the European Central Bank's stimulus scheme |
| 2020-05-05 | Defiant ECB Pledges Full Commitment After German QE Ruling The European Central Bank responded to a German court ruling criticizing its long-standing bond-buying program by pledging to continue doing everything necessary to revive inflation. |
| 2020-05-05 | 'Fed Is Propping Up Companies It Had Warned Banks Not to Touch It essentially endorsed the dubious practice with a program that may serve to bail out some of America's most leveraged companies.' |
| 2020-05-06 | During May 2020 year-over-year growth in the dollar money supply is at 29.8% up from April's rate of
21.3% and up from May 2019's rate of 2.15%. |
| 2020-05-07 | US National Debt Spiked by $1.5 trillion in 6 Weeks, to $25 trillion. Fed Monetized 90% The US gross national debt '' the total of all Treasury securities outstanding '' jumped by $1.05 trillion within 4 weeks.' |
| 2020-05-10 | Eurozone Breakup Risk Reaches New High Here is one that is way under the radar: The German Constitutional Court ruled the ECB's QE Program Could be Illegal. |
| 2020-05-10 | 'Germany's Constitutional Court upheld several complaints against the European Central Bank's purchase of government bonds under a program started in 2015,Germany's Constitutional Court upheld several complaints against the European Central Bank's purchase of government bonds under a program started in 2015' |
| 2020-05-12 | Germany's shock court ruling against the ECB challenges the stability of the euro zone The highest court in Germany said the ECB needed to explain why these government purchases are needed. |
| 2020-05-13 | Europe In Crisis: German Judges Strike Back Say ECB Isn''t Master Of The Universe Germany's top court continued to defend their controversial decision that questioned the constitutionality of the European Central Bank's asset repurchase program |
| 2020-05-13 | Germany's top court continued to defend their controversial decision that questioned the constitutionality of the European Central Bank's asset repurchase program |
| 2020-05-13 | The WHO announces that the virus "may never go away." |
| 2020-05-14 | House Narrowly Passes $3 Trillion Aid Package The House narrowly passed a sprawling, $3 trillion coronavirus-relief package Friday night” |
| 2020-05-14 | NEWS AND VIEWS FROM THE NEFARIUM MAY 14 2020 What's in the water in Karlsruhe? Because the German supreme court is on a tear through the EU |
| 2020-05-16 | 'The Fed just cut rates to 0% â here's what that means for mortgage rates Mortgage rates have dropped to 50-year lows in response to global concerns regarding the coronavirus outbreak' |
| 2020-05-17 | Goldman Spots A Huge Problem For The Fed, Jerome Powell said that "There's a lot more we can do. We've done what we can as we go. |
| 2020-05-18 | Wall Street Caught Short Again As Money Printer Go BRRRRRR To 11 hedge funds and various other levered investors - have continued to take down exposure, selling to retail investors all the way on the way up, assuming of course that Robin Hood is up on any given day.” |
| 2020-05-20 | Dr. Mark Skidmore provides a major update to his 2017 Missing Money Report. This update includes a review of redemptions in the U.S. Treasury market, indicating a much higher volume of redemptions than should be necessary to manage officially outstanding debt and raising questions regarding total outstanding debt. |
| 2020-05-21 | In Fink We Trust: BlackRock Is Now 'Fourth Branch of Government' The company's new assignment is a much bigger version of one it took on after the 2008 financial crisis, when the Federal Reserve enlisted it to dispose of toxic mortgage securities from Bear Stearns & Co. |
| 2020-05-22 | Is Jerome Powell the Real Keyser Soze? This is the first of as many episodes as it takes to explain how that theft mechanism in the Federal Reserve |
| 2020-05-27 | Brussels wants 750bn borrowing power to fund virus recovery Brussels has called for the power to borrow 750bn to bankroll recovery efforts after the coronavirus crisis |
| 2020-05-29 | Fed Reveals Which ETFs It Has Bought So Far Back in April, we published a list of which ETFs Goldman thought the Fed would purchase as part of its Secondary Market Corporate Credit Facility, which among others, included the HYG and JNK ETFs that held bonds by bankruptcy Hertz as we reported over the weekend. |
| 2020-05-29 | Trump announces that the U.S. will leave the WHO. He later announces a major partnership with GAVI. |
| 2020-05-31 | Protests and looting take place in 75 U.S. cities. The Fed has 37 board, bank, or branch locations in the U.S. - 33 have violent protests and looting. Following riots and arson in Minneapolis, maps of the city's Opportunity Zones raise serious questions about the redevelopment patterns in Fed cities and plans for "smart cities." Is the Fed financing "smart cities" through its newly authorized municipal and corporate bond buying? |
| 2020-06-00 | June / July: GAVI reports that Mastercard's Wellness Pass" program will be adapted to the pandemic response and integrated with Trust Stamp's biometric identity platform in a test on low-income Africans to prototype vaccinations integrated with biometric identity and payment systems. (See "Africa to Become Testing Ground for ‘Trust Stamp'' Vaccine Record and Payment System" by Raul Diego MintPress July 10 2020..” |
| 2020-06-02 | Bank of America Announces $1 Billion/4-Year Commitment to Support Economic Opportunity Initiatives Bank of America announced today that it is making a $1 billion four-year commitment of additional support to help local communities address economic and racial inequality" |
| 2020-06-02 | Rob Kirby - Globalism True Enemy of Humanity & America This is all going to end when the dollar is no longer accepted in trade by the rest of the world. |
| 2020-06-04 | European Central Bank Ramps Up Stimulus Program Beyond $1.5 Trillion The European Central Bank said it would vastly scale up its bond-purchase program to 1.35 trillion ($1.52 trillion) |
| 2020-06-04 | Jim Cramer: The pandemic led to "one of the greatest wealth transfers in history '' The coronavirus pandemic has produced one of the greatest wealth transfers in history, CNBC's Jim Cramer said. |
| 2020-06-04 | Bank of England balance sheet, from South Sea bubble (!) to COVID-19 Historical view of Bubbles |
| 2020-06-04 | John Titus reports on the Solari Report Money & Markets that the Fed has expanded its balance sheet by $2.8 trillion, or 60%-70%, since March 11, 2020. A similar size expansion in 2008-2012 took many years. The reported increase is primarily in Treasury bonds and mortgage-backed securities, but the Fed has authorized portfolios to buy corporate bonds and municipal bonds and to finance bank small-business loans. Some portfolio operations are outsourced to BlackRock. Some are backstopped by the Exchange Stabilization Fund. |
| 2020-06-05 | 'BlackRock Authored the Bailout Plan Before There Was a Crisis '' Now It's Been Hired by three Central Banks to Implement the Plan Black Rock is running the show.' |
| 2020-06-05 | 'Fed's Coronavirus Rescues Invite Bigger Bailouts The Federal Reserve purchased $100's B of Treasuries' |
| 2020-06-05 | The BIS announces it will open Innovation Hub centers in collaboration with the Bank of Canada (Toronto) the Bank of England (London) the ECB (Frankfurt and Paris) and four Nordic Central Banks in Stockholm. It will also form a strategic partnership with the Federal Reserve System (New York). The BIS has previously established Innovation Hubs in Singapore Hong Kong and Switzerland. |
| 2020-06-07 | GAVI reports that Mastercard's "Wellness Pass" program will be adapted to the pandemic response and integrated with Trust Stamp's biometric identity platform in a test on low-income Africans to prototype vaccinations integrated with biometric identity and payment systems. (See "Africa to Become Testing Ground for 'Trust Stamp' Vaccine Record and Payment System" by Raul Diego, MintPress, July 10, 2020.) |
| 2020-06-08 | A Crash in the Dollar Is Coming The world is having serious doubts about the once widely accepted presumption of American exceptionalism. |
| 2020-06-08 | Federal Reserve Board expands its Main Street Lending Program to allow more small and medium-sized businesses to be able to receive support CARES Act |
| 2020-06-09 | 'Goal of massive Cathay bailout is to protect Hong Kong's role as global aviation hub and ensure city's economic future, finance chief says Hong Kong officials view Cathay's possible collapse as a fundamental threat to the city's aviation sector' |
| 2020-06-11 | Stupid And Ridiculous : Rabobank Says The Fed Will Cause Everything To Come Crashing Down In Epic Ruin Really? That's how it works, is it? At this point anyone who can't see our real economic/financial market paradigm is either foolish, ignorant, or wilfully blind. |
| 2020-06-15 | 'The Federal Reserve Has Its Own Police and Is Part of a Vast Surveillance Center '' Should You Worry? Militarization of the Fed' |
| 2020-06-16 | Dirty Details Emerge as to Why Mnuchin Is Fighting Congress Over Releasing the Names of Recipients of PPP Loans PPP Loan Transparency |
| 2020-06-18 | 'If the Fed Is Being Honest that Citigroup is Well Capitalized, Why Did It Need $3 Billion from the Fed's Paycheck Protection Program? QE by any other name.' |
| 2020-06-19 | Fed Ends QE, Total Assets Drop. Liquidity Injection Ends The Big Shift: Fed shifts to propping up consumption rather than asset prices. |
| 2020-06-20 | 'Catherine Austin Fitts '' We are Watching the Mother of All Debt Entrapments What we are seeing is a reengineering of the global financial system on the just-do-it method' |
| 2020-06-21 | BlackRock is the New Vampire Squid Blackrock Bails Itself Out |
| 2020-06-22 | $340 Billion of the $454 Billion that Mnuchin Was to Turn Over to the Fed is Unaccounted For NA |
| 2020-06-22 | 'Plot Thickens on End of QE & Start of Shedding Assets Fed leads in trimming its balance sheet Bank of England governor publishes the reasoning for central banks to shed assets '' before raising interest rates. A big shift!' |
| 2020-06-25 | Report: The U.S. treasury sent stimulus payments to more than 1 million dead people Payments to dead people. |
| 2020-06-25 | 'Bloomberg Drops a Bombshell on the Fed's Big Bank Stress Tests Set for Release Today The Dow's drop of 710 points yesterday can be ascribed to two things: the alarming news reports that COVID-19 cases are skyrocketing in the second and third most populous states in the U.S.' |
| 2020-06-25 | 'Europe's Captials Take Aim at 750B Recovery Plan NA' |
| 2020-06-26 | ECB v Fed The Federal Reserve does not need permission to create elastic money. |
| 2020-06-27 | David Stockman On What Could Happen If The Fed Loses Control The truth is in an economy encumbered with nearly $78 trillion of debt already” |
| 2020-06-30 | The Bank of International Settlements (BIS) announces it will open Innovation Hub centers in collaboration with the Bank of Canada (Toronto), the Bank of England (London), the ECB (Frankfurt and Paris), and four Nordic Central Banks in Stockholm. It will also form a strategic partnership with the Federal Reserve System (New York). The BIS has previously established Innovation Hubs in Singapore, Hong Kong, and Switzerland. |
| 2020-07-01 | 'Billionaires '' Political Spending Grew 37-Fold in 10 Years U.S. billionaires gave 37 times as much in political contributions in the last election as they did 10 years earlier, according to a new study focusing on the richest Americans '' political giving.' |
| 2020-07-07 | 'Ghislaine Maxwell, Wall Street's Secrets and the U.S. Attorney's Office Outside of the Wall Street executives that did business with child sex trafficker Jeffrey Epstein, his first lieutenant, Ghislaine Maxwell, knows more about his Wall Street secrets than any other living person.' |
| 2020-07-07 | U.S. Units of Chinese Companies Got American Bailout Funds Chinese companies including conglomerate HNA Group Co. and affiliates of a state-owned defense giant were among recipients of the billions of dollars in coronavirus-relief loans handed out by the U.S. government. |
| 2020-07-07 | 'White House Wants Stimulus by August Recess With $1 Trillion Cap The White House wants Congress to pass another stimulus package by the first week in August, before lawmakers head home for their annual summer recess, and to keep the cost at $1 trillion or less, according to Vice President Mike Pence's top aide.' |
| 2020-07-08 | Extra $600 CARES Act unemployment benefit ends July 31. Here what you should know Enhanced Unemployment |
| 2020-07-13 | BIS and the Digital Currency Bank of International Settlements'' plans to roll out digital currency ultimately to replace cash |
| 2020-07-13 | 'Ron Paul: Will the Federal Reserve Cause the Next Riots? Fed's operations shows that the central bank is the leading cause of economic inequality.' |
| 2020-07-14 | 'House Hearing Today Examines Wall Street's Brand of Capitalism Versus the Health of the U.S. Economy The House Financial Services '' Subcommittee on Investor Protection, Entrepreneurship and Capital Markets will convene a hearing at noon today that is titled: Promoting Economic Recovery: Examining Capital Markets and Worker Protections in the COVID-19 Era.' |
| 2020-07-14 | SITUATION CRITICAL: The Fed. Is About To Sell You Another MASSIVE LIE. Mannarino Crude Oil News |
| 2020-07-16 | Carlyle Group announces it is seeking to raise $2 billion for an Americas growth equity fund dedicated to mid-size private equity deals in North America, "according to people with knowledge of the matter" (Bloomberg). Chairman Powell of the Federal Reserve is considered to be worth over $100MM made as a partner at Carlyle during the explosive investment in globalization that occurred as money began going missing from U.S. accounts. |
| 2020-07-17 | New SEC Rule Means Holdings Of Dalio, Einhorn, Soros And More Could Go Completely Dark Some of the biggest investors in the world would see their holdings go dark if the SEC implements a new rule concerning Form 13F disclosures that it has recently proposed." |
| 2020-07-21 | Dodd-Frank Is 10 Years Old Today and the Fed Is Back to Bailing Out Wall Street 2008 More of the Same |
| 2020-07-22 | U.S. regulators (Office of the Comptroller of the Currency or OCC) grant authority to U.S. banks to hold and offer cryptocurrencies. |
| 2020-07-23 | Federal Reserve Board announces expansion of counterparties in the Term Asset-Backed Securities Loan Facility, Secondary Market Corporate Credit Facility, and Commercial Paper Funding Facility Fed Expands Stimulus Range |
| 2020-07-29 | Federal Reserve issues FOMC statement The coronavirus outbreak is causing tremendous human and economic hardship across the United States and around the world. Following sharp declines, economic activity and employment have picked up somewhat in recent months but remain well below their levels at the beginning of the year. Weaker demand and significantly lower oil prices are holding down consumer price inflation. |
| 2020-07-30 | In Unprecedented Move, Congress Proposes Taxpayer-Funded Bailout Of $550 Billion CMBS Industry NA |
| 2020-08-01 | U.S. Gets a Debt Warning From Fitch as Stimulus Battle Rages $600/wk trickle down payments to Main St. |
| 2020-08-03 | The Fed Has Secreted Away the Transactions of Three of Its Emergency Lending Programs Less Transparency.. |
| 2020-08-05 | Wall Street Banks that Got the Biggest Fed Bailouts Have Been Dogs to Shareholders Over the Past 15 Years NA |
| 2020-08-11 | Bombshell Report: Fed Is Aware that Big Banks Are Rigging their Stress Tests and Letting Them Get Away with It Derivates Slight of Hand |
| 2020-08-12 | $15 Billion In Federal Funding Flows Into Just Five Major U.S. Cities Where Civil Unrest Looms & Police Stand Down NA |
| 2020-08-12 | 'The Fed's Silent Takeover of the U.S. NA' |
| 2020-08-13 | Apple Launches Unprecedented Second Bond Offering To Fund Billions In Buyback: How Much Will The Fed Buy NA |
| 2020-08-13 | Wall Street Banks Sell Off in Midst of Largest Treasury Auction in History NA |
| 2020-09-10 | The Fed Has Loaned $1.2 Billion from its TALF Bailout Program to a Tiny Company with Four Employees NA |
| 2020-09-24 | In Unprecedented Monetary Overhaul, The Fed Is Preparing To Deposit Digital Dollars Directly To Each American Fed Crypto |
| 2020-09-30 | Fed Caps Big Banks Dividends, Halts Share Buybacks in Fourth Quarter Fed pulls back on the reigns.. |
| 2020-10-01 | BitCoin Investment Thesis Great Currency Reset |
| 2020-10-09 | White House Draws Up New $1.8 Trillion Virus-Relief Proposal Trickle down to the masses.. |
| 2020-10-12 | 'Central Banks Haven't Made a Convincing Case for Digital Currencies Great Currency Reset' |
| 2020-10-13 | IMF, World Bank, G20 countries to create Central Bank Digital Currency rules Great Currency Reset |
| 2020-10-14 | Fed governor says central bank will partner with MIT on possible digital currency Great Currenct Reset |
| 2020-10-15 | Fed Chairman Powell to Speak About Digital Currencies Next Week at IMF Great Currency Reset |
| 2020-10-16 | 'Bahamas to Roll Out âSand Dollar '' Digital Currency Next Month Great Currency Reset' |
| 2020-10-16 | 'Digital Euro Within Decade'very Likely, '' Says Finland's Chief Central Banker Great Currency Reset' |
| 2020-10-27 | 'Congresswoman Katie Porter Says Fed Is Playing Kingmaker on Wall Street and Appears Corrupt 'the Fed's Corruption''' |
| 2020-11-01 | Banks, QE, and Money-Printing Money Printing |
| 2020-11-01 | Donald Trump, Joe Biden: Erase Student Loans! Student Loan Forgiveness |
| 2020-11-06 | Select Language In 2020, Central Bankers Everywhere Are Being Exposed Weimar Money Printing |
| 2020-11-13 | 'The Fed Says It's Considering a Central Clearing Facility for the Treasury Market Fed to purchase Treasuries' |
| 2020-11-17 | 'Congresswoman Katie Porter Tells the Fed that It's Got a Big Problem Corporate Bond Buying' |